04 / Live Dashboards
Dashboards
built to
perform.
01 · Production
● LIVE
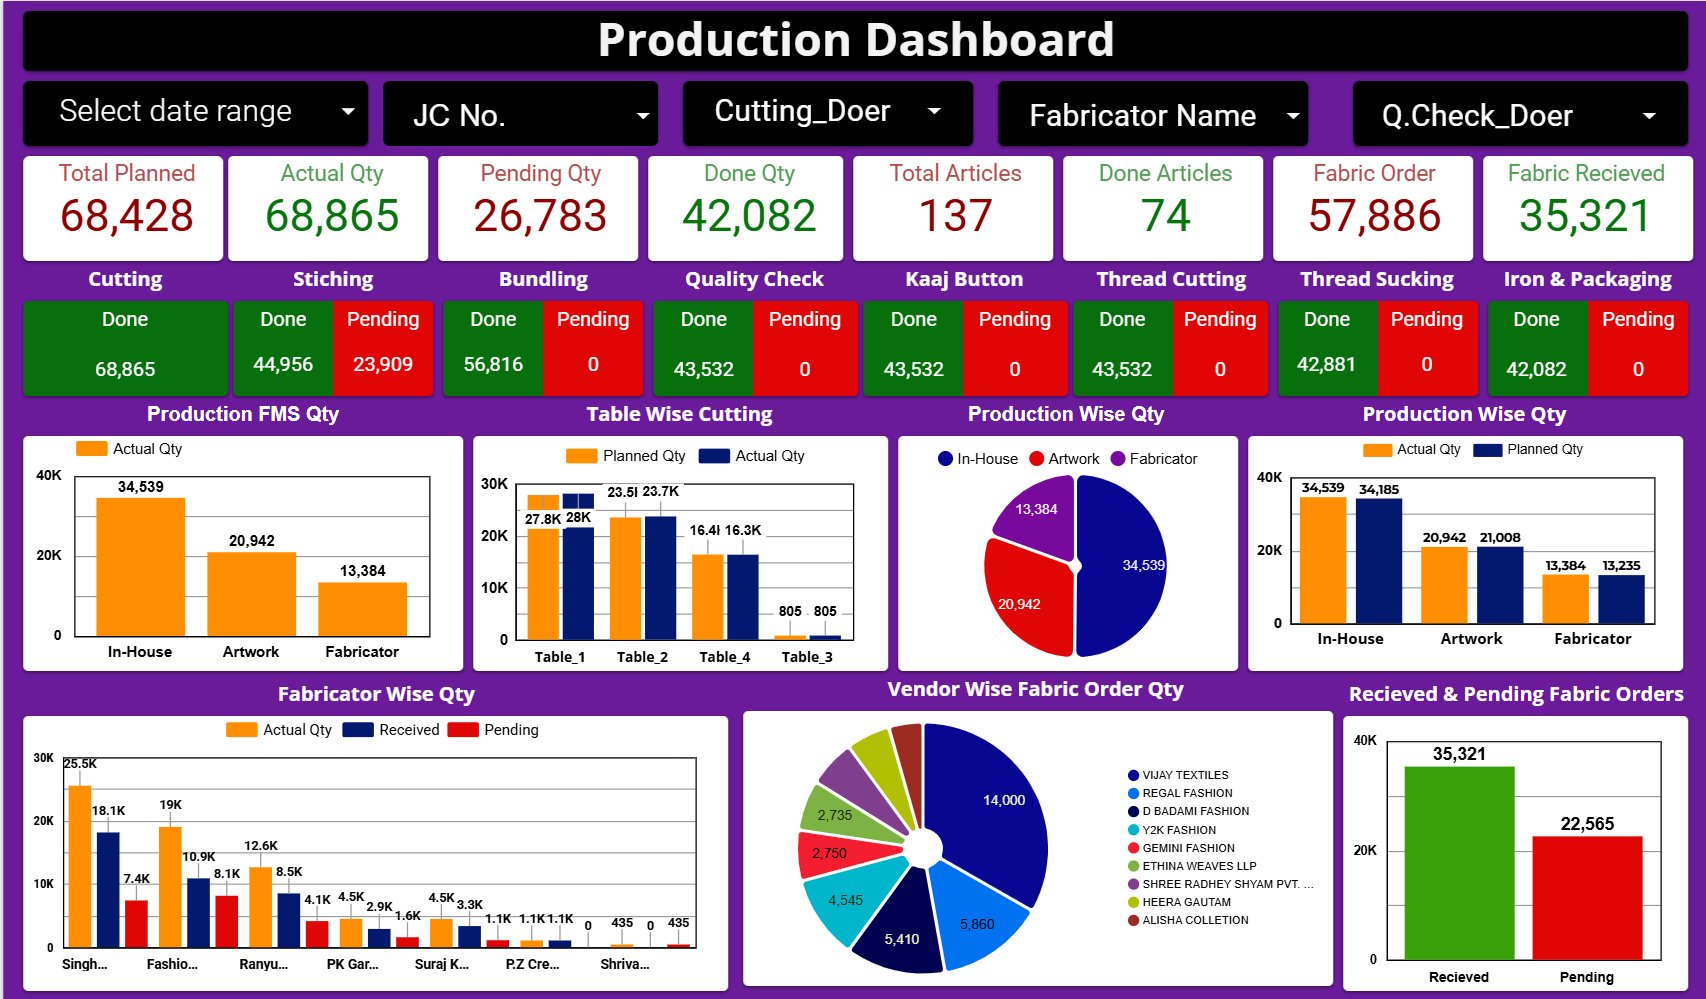
Production Dashboard
End-to-end production tracking for Avi Couture Pvt Ltd. Monitors 68K+ planned units across cutting, stitching, bundling, quality check, and packaging — with live fabricator-wise and table-wise breakdowns.
68K+
Units Tracked
8
Stages Monitored
Live
Real-Time Data
→
02 · Operations
● ACTIVE

Check List Dashboard
Department-wise task tracking system for daily (D), weekly (W), monthly (M), and quarterly (Q) operations. Tracks 2,000+ tasks across 7 team members with status breakdowns — Done, Pending, and Not Today.
1,982
Tasks Done
6
Departments
7
Team Members
→
2
Live Dashboards
68K+
Units Monitored
Real-Time
Data Sync
40%
Efficiency Gained